An Introduction to a Series Analysing England’s Landscape and its Future in a Time of Rapid Change
“When we build, let us think that we build forever. Let it not be for present delight nor for present use alone. Let it be such work as our descendants will thank us for”
(John Ruskin)
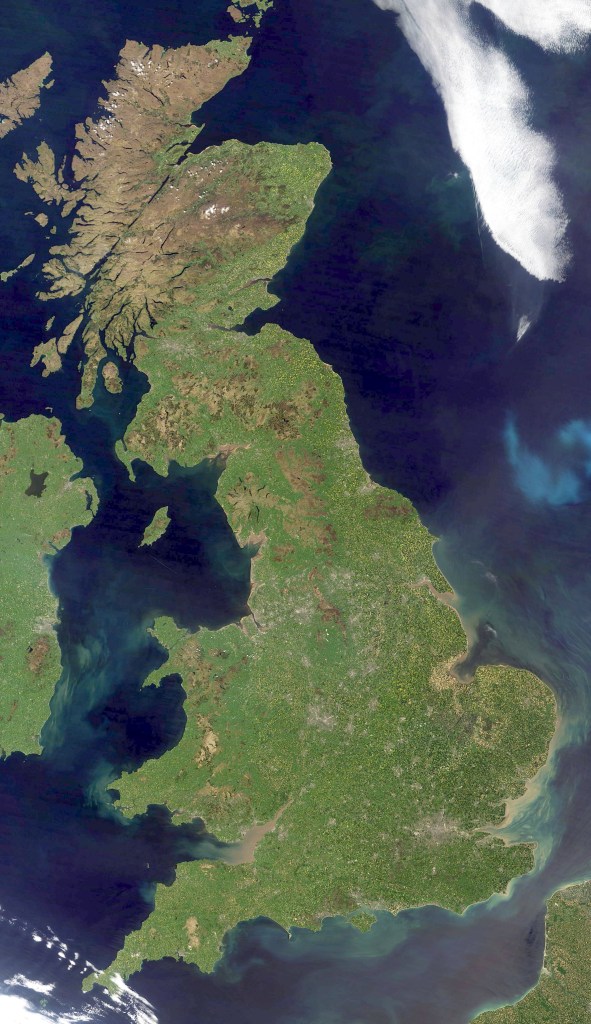
The Fate of England’s countryside, the patchwork of fields, hedgerows, moorlands and woodlands which has shaped our history, culture and wildlife for centuries, currently hangs in the balance.
With a total land area of approximately 13 million hectares, this small but densely populated country supports over 58 million souls, making it one of the most tightly packed nations in Europe. Yet beneath the statistics lies a more complex story of constrained landscapes, protected wild places and productive farmland that has sustained us for generations.
Here I attempt to tell this story with a view to inspire thought, and caution, about how we treat, and value, this land of ours.
Official Designations
Official figures reveal that around 8.7% of England’s land is classified as developed (buildings, roads and associated infrastructure), rising to roughly 10.5% when urban green spaces and gardens are included.
Agriculture still claims about 63% of the land, while forestry, semi-natural habitats and open water make up much of the remainder. Overlapping protections: National Parks, Areas of Outstanding Natural Beauty (AONBs, now officially known as National Landscapes), Sites of Special Scientific Interest (SSSIs) and Green Belt land, safeguard more than a third of the country in one form or another.
These are not empty designations; they protect the very character of our landscapes, from the South Downs to the Lake Districts fells.
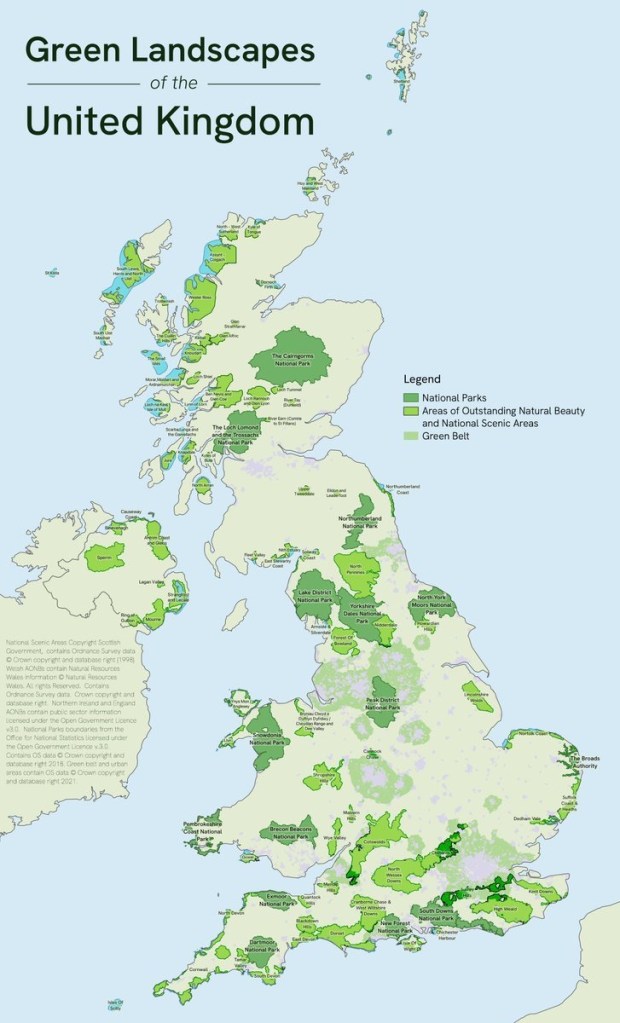
(mapsontheweb.com)
What Land Is Truly Developable?
‘Developed’ and ‘developable’ are hard terms to define, and such ambiguity is often abused, so I make it clear here that I use these terms to describe land that has been, or could be, viably built upon at a scale greater than 10 homes or 0.5 hectares (the size of a small village).
Much of England’s uplands, flood-prone lowlands, coastal marshes, high-grade agricultural soils and ecologically rich habitats simply cannot, or should not, be built upon without irreversible loss. After accounting for these constraints, the genuinely available lowland or lower-grade land suitable for large-scale development is far more limited than headline figures suggest, perhaps only 40 to 50% of the total area in practical terms.
To put this in perspective, the space available per person across England’s entire land area works out at roughly:
13,050,000 hectares ÷ 58,600,000 people ≈ 0.223 hectares per person
(or about 2,230 square metres, so roughly a third of a football pitch).
This includes every windswept moor and remote hillside. When one considers only the viable lowland areas, the pressure becomes starkly apparent.
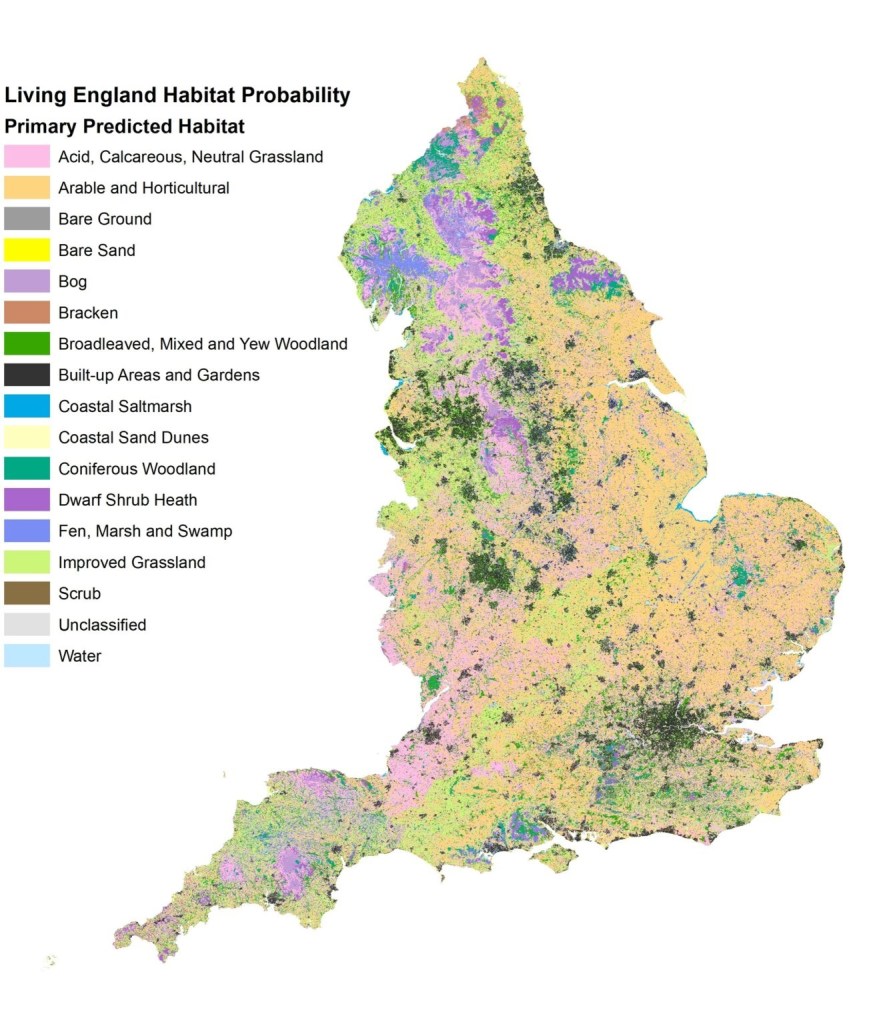
(Natural England)
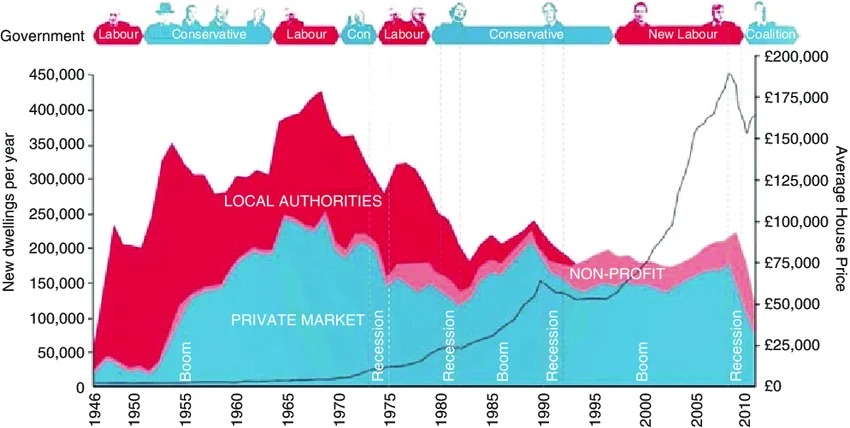
Housebuilding Targets Versus Reality
Successive governments have set ambitious targets, including proposals for 300,000 new homes annually. In practice, delivery has fallen short, with net additional dwellings hovering around 210,000 to 220,000 in recent years. At a typical net density of around 35 dwellings per hectare (accounting for roads, gardens and infrastructure), even the current rate consumes approximately 6,000 hectares of land per year.
Meeting the higher targets would push this toward 8,500 hectares annually, modest as a percentage of total land, but highly significant when concentrated on the remaining viable agricultural and greenfield sites in the lowlands.
Population growth, driven overwhelmingly by net international migration, continues to fuel demand. Any shift toward moderated migration or policies encouraging remigration under changing governments could ease future housing pressure, yet the existing backlog of unmet need and household formation ensures the debate remains urgent.
Balancing Homes, Heritage and Habitat
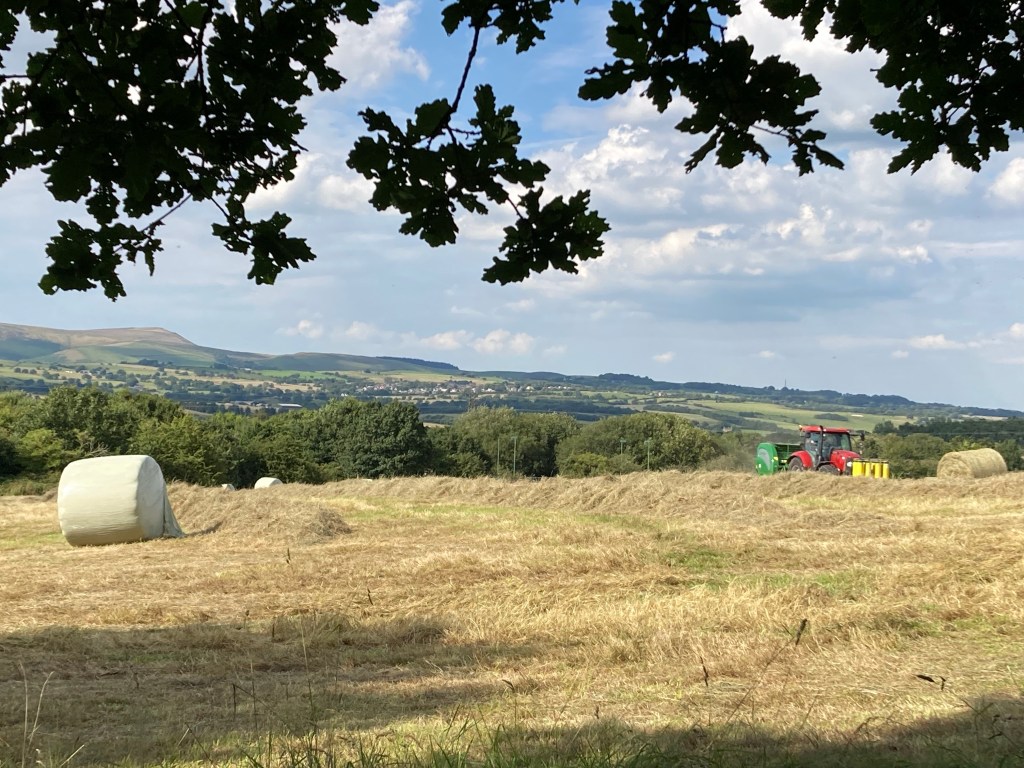
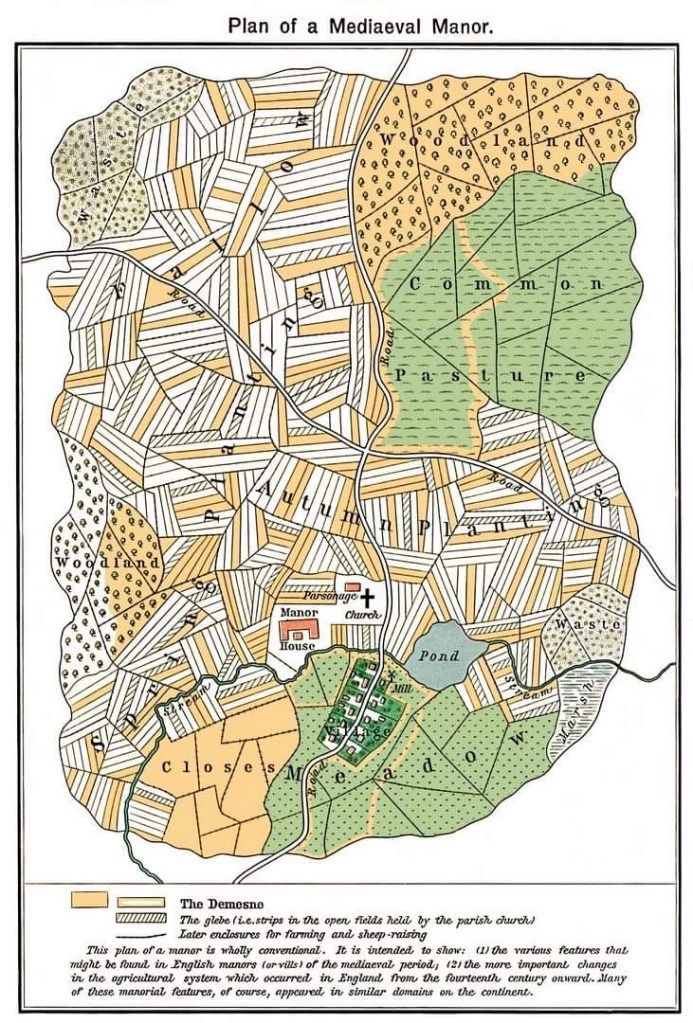
The drive for housebuilding risks repeating familiar patterns: short-term economic boosts through construction at the expense of long-term food security, biodiversity and landscape character. England’s productive farmland, much of it the very soil that has fed generation upon generation, is not an infinite resource. Converting it permanently for housing carries lasting consequences for nature recovery, carbon storage and the rural heritage that defines so much of England.
Our countryside has never been a wilderness untouched by human hand; it is a living, working landscape shaped by centuries of careful stewardship. True solutions lie not in blanket targets that threaten our best agricultural land and protected places, but in prioritising brownfield regeneration, increasing densities sensitively where appropriate, innovating in construction methods, and above all, recognising the finite nature of England’s green and pleasant land.
List of Key Sources & References
• Land Use Statistics:
https://www.gov.uk/government/statistics/land-use-in-england-2022/land-use-statistics-england-2022
• Agricultural Land Use:
https://www.gov.uk/government/statistics/agricultural-land-use-in-england/agricultural-land-use-in-england-at-1-june-2025
• Population Estimates:
https://www.ons.gov.uk/peoplepopulationandcommunity/populationandmigration/populationestimates/bulletins/populationestimatesforenglandandwales/mid2024
• Housing Supply: Net Additional Dwellings 2023-24
https://www.gov.uk/government/statistics/housing-supply-net-additional-dwellings-england-2023-to-2024/housing-supply-net-additional-dwellings-england-2023-to-2024
• Housing Supply: Net Additional Dwellings 2024-25
https://www.gov.uk/government/statistics/housing-supply-net-additional-dwellings-england-2024-to-2025
• Local Authority Green Belt: 2024-25
https://www.gov.uk/government/statistics/local-authority-green-belt-statistics-for-england-2024-to-2025
• Land Use Change Statistics:
https://www.gov.uk/government/statistics/land-use-change-statistics-2021-to-2022
Thank-you for reading. If you enjoyed this piece and would like to support further articles on the wildlife and history of the Northwest, you can buy me a coffee here.
Alex Burton-Hargreaves
(June 2026)

As a southerner exiled in the north, it’s comforting to see the South Downs, one of Britain’s most beautiful landscapes, acknowledged in a site dedicated to the northwest 🙂 Most of the people I meet in the north know nothing about it and assume it’s something to do with the M25 car park. Parochialism aside, this is an excellent article and so well researched – thank you. The thing is, very few of our resources are infinite, whether land, mineral, or whatever. So, at some point, even without a growing population, our descendants (ie great grandchildren x ?) are going to run out of things.
LikeLiked by 1 person